Enhancing Probabilistic Time Series Analysis with R's Crossvalidation Package
Probabilistic forecasting is gaining prominence, and the integration of new methods within the R ecosystem highlights how practitioners can refine their predictive accuracy. With the growing complexity of time series data, ensuring that predictions not only offer point estimates but also reliable confidence intervals is paramount. The latest developments in the R package crossvalidation underscore a vital shift towards evaluating how well these prediction intervals perform.
Understanding Probabilistic Forecasting
At the heart of probabilistic forecasting lies the premise that providing a range of possible outcomes is often more informative than a single predicted value. This is particularly relevant in fields like finance, supply chain management, and weather forecasting, where uncertainty is intrinsic. The crossvalidation package aims to bridge this gap by emphasizing the evaluation of prediction intervals, not just point forecasts. This is an important step, as traditional forecasting methods often overlook the calibration of these intervals, leading to potentially misleading interpretations of data.
Key Evaluation Metrics
The evaluation metrics introduced within the crossvalidation framework include empirical coverage rates and Winkler scores. These metrics allow practitioners to assess the quality of their prediction intervals effectively. The empirical coverage rate is the proportion of times that the actual outcomes fall within the predicted intervals, while the Winkler score provides a more nuanced measure of the accuracy of interval forecasts, accounting for the magnitude of errors. The inclusion of these metrics as standard practice can shift how model performance is interpreted and optimized.
Case Studies Using Air Passenger Data
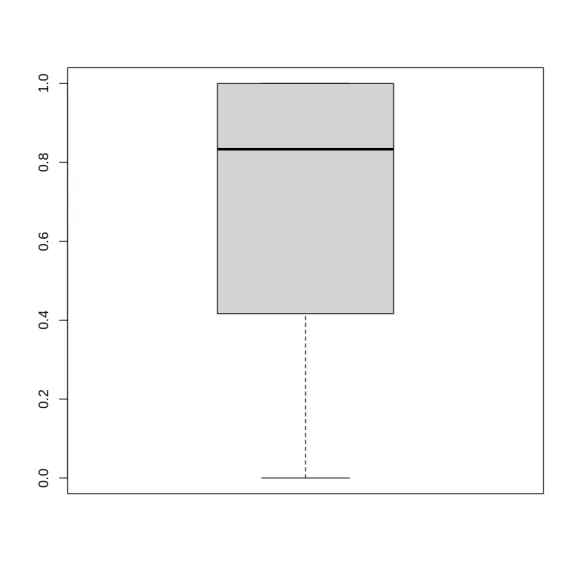
A practical demonstration involves the iconic AirPassengers dataset, which tracks monthly airline passenger numbers from 1949 to 1960. By applying various forecasting methods using the crossvalidation package, users can compare performance across different models. The R code snippets provided allow for straightforward implementation. Notably, the metrics’ outputs illustrate substantial variation in both coverage rates and Winkler scores across different forecasting methods like the theta model used in the examples.
install.packages("remotes")
install.packages("forecast")
remotes::install_github("Techtonique/crossvalidation")
library(crossvalidation)
By running these models, users observe essential numerical outputs across multiple iterations. For instance, one result set presented a 33.3% coverage for a 95% interval, as seen in results where intervals did not adequately capture the true value — highlighting an area for model refinement.
The Implications for Forecasting Practices
What stands out from these findings is not merely the performance of specific models, but rather the implication that many existing forecasting practices may be grossly oversimplified. The tendency has often been to rely on point forecasts without adequately assessing their reliability through probabilistic measures. This evolving methodology pushes practitioners to reflect critically on their forecasting strategies, especially in contexts where high-stakes decisions rely on accuracy.
What’s Missing in the Current Conversation?
While there’s a clear momentum towards probabilistic forecasting, discussions surrounding the practical challenges of implementation remain sparse. For example, integrating these metrics into existing workflows often requires significant adjustments, not just in methodology but also in mindset. Stakeholders must be ready to embrace a paradigm shift that prioritizes uncertainty alongside point predictions.
Additionally, there’s a prominent gap regarding user-friendly documentation and community support for the crossvalidation package. With R continually evolving, providing comprehensive resources becomes increasingly vital for wider adoption among industry professionals.
Conclusion: The Path Ahead
If you're working in fields dependent on high-quality forecasts, exploring probabilistic forecasting with R's crossvalidation package shouldn't be an afterthought; it should be a core component of your analytical toolkit. Look for opportunities to incorporate uncertainty analysis into your models actively. The take-home message here? The complexity of today’s data landscape demands an equally sophisticated approach to forecasting — one that acknowledges and quantifies uncertainty, ultimately leading to smarter, data-driven decisions.