
When analysing property price performance at town and city level, Kate Faulkner reveals Northern cities are coming out on top.
9th Feb 20260 369 2 minutes read Kate Faulkner OBE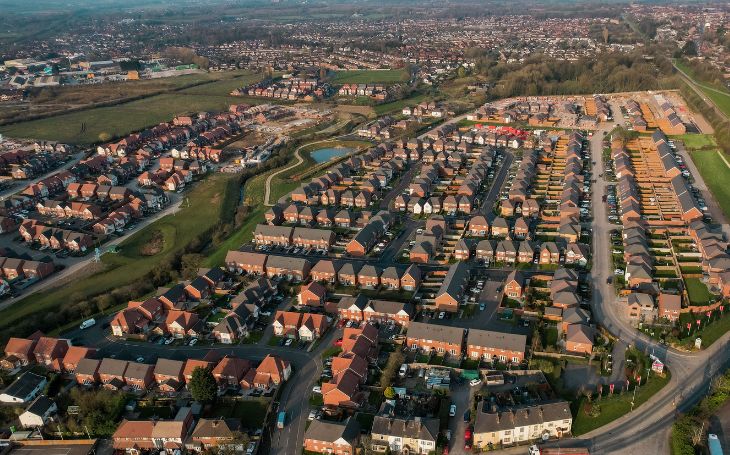 With a little help from AI this month, the town and city tracker data shows which areas are doing well and not so well – depending on the measure used.
Looking at the year-on-year property price growth and comparing Land Registry to more recent Hometrack data, Belfast is the standout performer across both data sets and Norther cities dominate the top half of both rankings.
Southern and commuter-belt markets cluster towards the bottom, particularly in the Land Registry data.
When analysing city performance since 2022 and the great mortgage rate rise, the YoY performance is reflected in what’s been happening over the last 3-4 years.
The Land Registry tells a medium term recovery story – Glasgow, Bradford, Belfast and Liverpool have seen double-digit gains since 2022, reflecting transaction-backed price recovery, not short-term sentiment.
Hometrack shows momentum is cooling – with the exception of Belfast, most top Land Registry risers are now only showing 2-3% YoY, suggesting those markets have already done much of the catching up.
Long term city property price performance versus general inflationThe city data shows that, despite strong recent growth in some regional markets, and especially in Belfast, a significant number of UK cities have failed to outperform inflation since 2005, underscoring the importance of long-term rather than short-term performance.
The analysis shows that long-term winners are concentrated in London and the South East, while Manchester is the standout regional city which has performed well.
Other popular regional markets that have not beaten inflation over nearly 20 years include Birmingham, Liverpool and Newcastle. Belfast’s recent strength masks a weak long-term inflation-adjusted performance.
AI concludes for us: “Land Registry data shows that London, Bristol and Manchester have delivered the strongest house price growth since the 2007/08 peak, while several regional markets have yet to fully recover from the financial crisis.”

Appendix: City/town property indices price tracking
For city/town tracking, we use Land Registry (government data) and Zoopla/Hometrack. The Land Registry data is useful because we can analyse how property prices have changed over time and this helps us to put today’s price information into context.
The Zoopla/Hometrack data is useful as they take into account the change in mix of property transactions during the pandemic to houses away from flats. This has meant the likes of the Land Registry and other indices have over exaggerated price changes year on year.
Tagshouse prices 9th Feb 20260 369 2 minutes read Kate Faulkner OBE Share Facebook X LinkedIn Share via Email
